Posted on

In 2 Charts: Why the ‘War on Poverty’ Should Be Renamed the ‘War on Marriage’

iB-marriage-penalty-2014-chart-2_HIGHRES-1024x720


In 2 Charts: Why the ‘War on Poverty’ Should Be Renamed the ‘War on Marriage’

Kelsey Harris / @KelsRenHar / December 03, 2014

“First comes love, then comes marriage, then comes a baby in a baby carriage.” Sort of.

I grew up singing the “K-I-S-S-I-N-G” jingle with my elementary school friends during recess. Now many of those same friends have the baby in the baby carriage and a boyfriend. They aren’t alone.

>>>REPORT: How Welfare Undermines Marriage

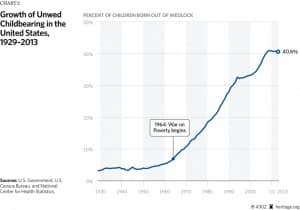
According to research by Robert Rector, an expert in welfare at the Heritage Foundation, more than 40 percent of all children born in the U.S. were born outside of marriage in 2013, and the number of single-parent families with children has skyrocketed by nearly 10 million.

Rector explains how the War on Poverty undermined marriage:

It is no accident that the collapse of marriage in America largely began with the War on Poverty and the proliferation of means-tested welfare programs that it fostered. When the War on Poverty began, only a single welfare program—Aid to Families with Dependent Children (AFDC)—assisted single parents. Today, dozens of programs provide benefits to families with children, including the Earned Income Tax Credit (EITC), Temporary Assistance for Needy Families (TANF), the Women, Infants and Children (WIC) food program, Supplemental Security Income (SSI), food stamps, child nutrition programs, public housing and Section 8 housing, and Medicaid. Although married couples with children can also receive aid through these programs, the overwhelming majority of assistance to families with children goes to single-parent households.

These charts breakdown exactly how much marriage and childbearing has changed since 1964.

IB-marriage-penalty-2014-chart-3_HIGHRES-559x1024

Posted on

War on Poverty Turns 50: Are We Winning Yet?

war-on-poverty

War on Poverty Turns 50: Are We Winning Yet?

By Michael D. Tanner and Charles Hughes
October 20, 2014

The War on Poverty is 50 years old. Over that time, federal and state governments have spent more than $19 trillion fighting poverty. But what have we really accomplished?

Although far from conclusive, the evidence suggests that we have successfully reduced many of the deprivations of material poverty, especially in the early years of the War on Poverty. However, these efforts were more successful among socioeconomically stable groups such as the elderly than low-income groups facing other social problems. Moreover, other factors like the passage of the Civil Rights Act, the expansion of economic opportunities to African Americans and women, increased private charity, and general economic growth may all have played a role in whatever poverty reduction occurred.

However, even if the War on Poverty achieved some initial success, the programs it spawned have long since reached a point of diminishing returns. In recent years we have spent more and more money on more and more programs, while realizing few, if any, additional gains. More important, the War on Poverty has failed to make those living in poverty independent or increase economic mobility among the poor and children. We may have made the lives of the poor less uncomfortable, but we have failed to truly lift people out of poverty.

The failures of the War on Poverty should serve as an object lesson for policymakers today. Good intentions are not enough. We should not continue to throw money at failed programs in the name of compassion.

https://www.cato.org/publications/policy-analysis/war-poverty-turns-50-are-we-winning-yet?utm_content=buffera4907&utm_medium=social&utm_source=facebook.com&utm_campaign=buffer

Posted on

This Chart Proves the War on Poverty Has Been a Catastrophic Failure

SR-culture-index-2014-self-sufficency-747

This Chart Proves the War on Poverty Has Been a Catastrophic Failure
Robert Rector / July 28, 2014

For the past 50 years, the government’s annual poverty rate has hardly changed at all. According to the U.S. Census Bureau, 15 percent of Americans still live in poverty, roughly the same rate as the mid-1960s when the War on Poverty was just starting. After adjusting for inflation, federal and state welfare spending today is 16 times greater than it was when President Johnson launched the War on Poverty. If converted into cash, current means-tested spending is five times the amount needed to eliminate all official poverty in the U.S. How can the government spend so much while poverty remains unchanged?

The answer is simple: The U.S. Bureau of the Census official “poverty” figures are woefully incomplete. The Census defines a family as poor if its annual “income” falls below specific poverty income thresholds. In counting “income,” the Census includes wages and salaries but excludes nearly all welfare benefits. The federal government runs over 80 means-tested welfare programs that provide cash, food, housing, medical care, and targeted social services to poor and low-income Americans. Government spent $916 billion on these programs in 2012; roughly 100 million Americans received aid from at least one of them, at an average cost of $9,000 per recipient. (These figures do not include Social Security or Medicare.)

Of the $916 billion in means-tested welfare spending in 2012, the Census counted only about 3 percent as “income” for purposes of measuring poverty. In other words, the government’s official “poverty” measure is not helpful for measuring actual living conditions.

On the other hand, the Census poverty numbers do provide a very useful measure of “self-sufficiency”: the ability of a family to sustain an income above the poverty threshold without welfare assistance. The Census is accurate in reporting there has been no improvement in self-sufficiency for the past 45 years..

https://dailysignal.com/2014/07/28/index-culture-opportunity/?utm_source=facebook&utm_medium=social